The Diet Diary Android application

The Diet Diary is an an Android application that contain USDA databse of foods and alllows easy and intuitive reporting of food intake. The key features of the Diet Diary include:

  1. Searchable and consumer-adapted USDA database
  2. Drop lists for selecting serving size
  3. Ability to take pictures of the meal before and after the meal
  4. Ability to take pictures of any given food
  5. Automatic computation of caloric content
  6. Automatic recording of date/time/duraton of a meal
  7. Automatic upload of the food records and pictures to a remote server
  8. Web interface to the food diaries
  9. Ability to work in pair with Automatic Ingestion Monitor (AIM) (AIM) and prompt the user when AIM detects food intake (in progress)

More information, screen shots and example of food diaries coming soon

Automatic Ingestion Monitor (AIM)

Automatic Ingestion Monitor (AIM)

AIM is a device that can objectively monitor someone's food intake, and determine when it takes place, measures duration of the meal, provides counts of bites and chews, estimates mass of intake and caloric content of the meal.


more information coming soon


2006. Self-powered wireless sensor

Self-powered wireless sensor


The following information describes demonstration of a wireless self-powered pressure sensor.

Piezoelectric materials, vibrating machinery and rectifying circuitry was kindly made available by Advanced Cerametrics.

The goal of the demonstration is to show feasibility of creating vibration-powered sensors that do not use batteries for data acquisition.


The following image show the experimental setup of the demo:


In this specific example the energy was provided by a vibrating bimorph cantilever element excited by a small electric motor. The speed of the motor was controlled by a potentiometer. During experiments the motor speed was set to the minimal possible excitation level.

Vibrating bimorph provided about 40V peak-to-peak voltage that was rectified by a bridge circuit and stored in a capacitor bank of about 1000uF. Ceramic capacitors were used by ACI to minimize leakage currents. The max voltage on the capacitors was limited to 6V by a Zener diode. This voltage was converted to a 3.3V level by a linear regulator from TI. The regulator used in the circuit featured very low quiescent current (~3uA).

In the present incarnation the energy conversion circuitry has low energy efficiency, but still provides enough power to the sensor node.

The 3.3V voltage was used to power a WISAN node. Most of the time the sensor node spent in deep sleep (ultra-low power consumption mode) consuming only about 9uW of energy (or about 3uA current consumption). Only the real-time clock circuitry was active on the processor core, keeping precise time until the next sample of data. The data were sampled at 30Hz sampling rate.

The pressure sensor (see the following Figure) was of resistive type, made from carbon-infused conductive foam that changes resistance with applied pressure. The sensor was powered on immediately before a sample of data was taken and powered off immediately after. Duration of each sample (sample-and-hold plus conversion) was about 64us to minimize sensor noise.


The sampled sensor data were stored in the WISAN's node memory until accumulation of 100 data points at which time a single radio transmission by an IEEE802.15.4 MAC compatible software transmitted a packet of data to the receiver. The receiver node displayed pressure data on the LCD and transmitted the same data packet to the host PC via a USB interface.

The following figure shows the front end of the PC viewer application.


The following video shows the system at work.


Energy harvesting conclusions

In collaboration with ACI we have succesfully demonstrated an operational demo of a self-powered pressure sensor based on piezoelectric energy harvesting. The vibrating bimorph produced power which was sufficient to provide continuous sampling of the pressure sensor data at 30Hz and deliver acquired data via an IEEE802.15.4 link to the remote destination. The efficiency of the energy harvesting circuit can be further improved and give more energy for data acquisition and/or storage or allowing less vibration levels to power the system.

2007. Electromagnetic energy harvesting from bridge vibration

Energy harvesting as enabling factor for bridge monitoring


Wireless monitoring of civil engineering structures such as bridges and overpasses has gained a lot of interest in the recent years. Bridge collapses happen suddenly and unpredictably and often lead to tragic loss of human lives. In 2006 Federal Highway Administration listed 25.8% of nation's 596,842 bridges either as structurally deficient or functionally obsolete. While many of these bridges will remain in service for many years, they need monitoring and rehabilitation.

Presently, bridge monitoring is performed through periodic visual inspections. In the tragic example of I-35W Mississippi River bridge collapse, the bridge passed a visual inspection a year prior to failure. Many researchers are suggesting installing wireless monitoring sensors that can continuously monitor bridge condition and report any changes that may lead to failure. Wireless sensors are easy to install and can be applied to existing highway infrastructure.

The problem arises in proving power to operate wireless sensors for bridge monitoring. Since every bridge would have at least several sensors which could be installed in hard to access locations. Replacing millions and millions of batteries would become a huge logistic problem and add to the expense of maintaining bridges. Another important factor is environmental impact of discarding used batteries.

We suggest using vibration of bridges caused by passing traffic, wind and microtremors to power the bridge monitoring sensors. The battery is completely eliminated from the equation. Hermetically sealed sensors powered by bridge vibration can remain on the bridge for decades and provide continuous monitoring.

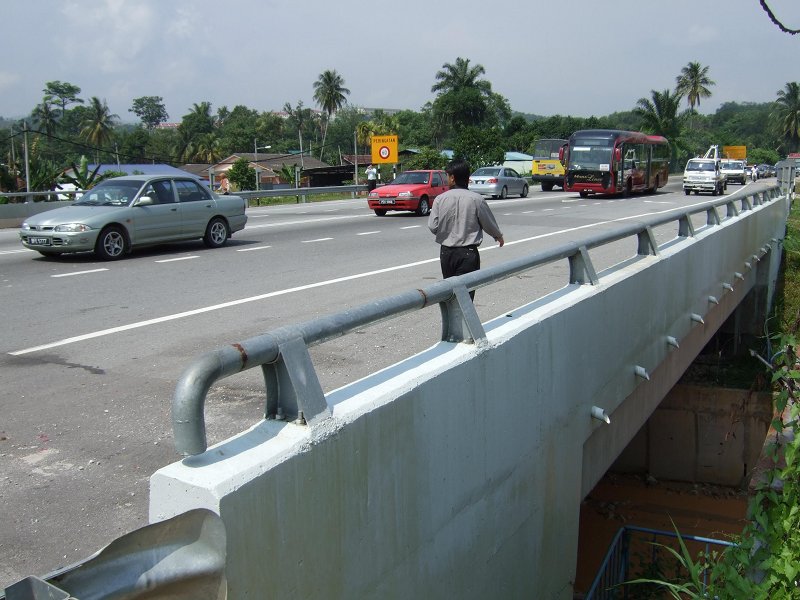
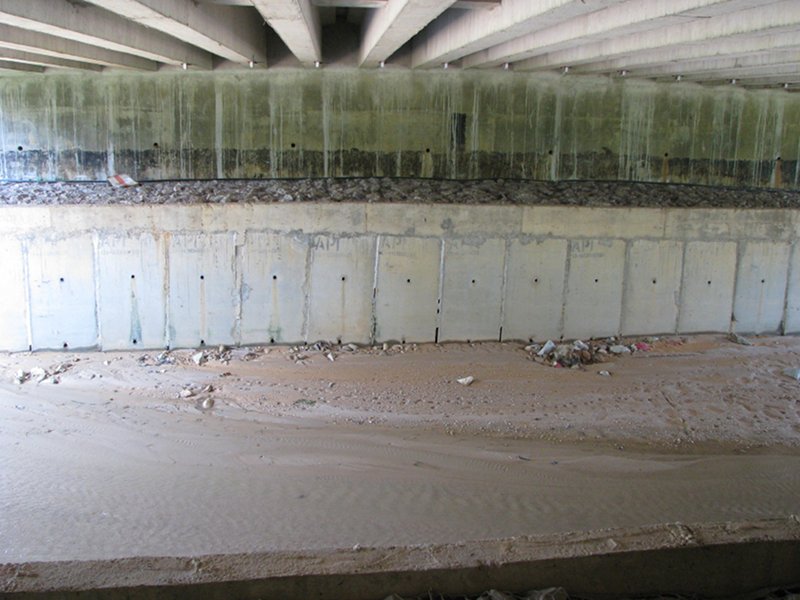
We use RT11 bridge in Potsdam, NY for a case study.


Figure 1. RT11 bridge in Potsdam (February 2006)

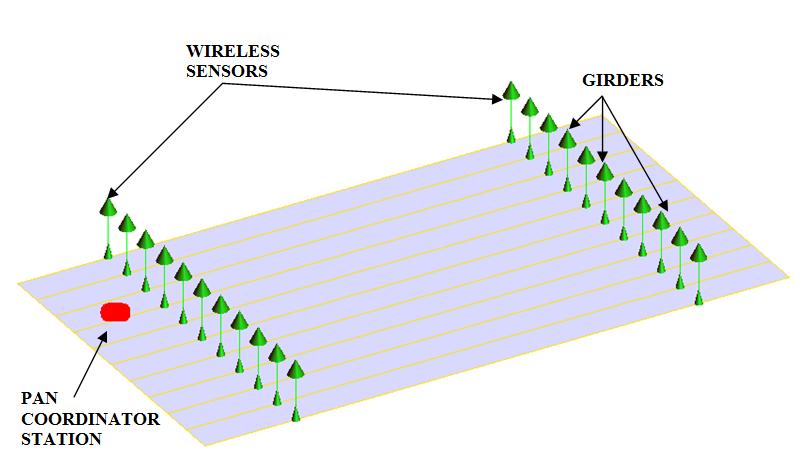
RT11 bridge is a steel girder bridge, one of the most common types of bridges. Energy can be harvested by locating a generator and sensors on the bottom or top flange of a girder. The following figure shows the spot where the self-powered sensor was installed.

Figure 2. Location of sensor installation


Figure 3. Electromagnetic energy harvester


Vibration of the bridge is harvested by an aircore tubular linear generator which responds to one of the natural vibration frequencies of the bridge. Each time a car or a truck pass over the bridge, even in the different lane from the sensor installation, the whole structure vibrates and excites the mover in the generator thus producing AC voltages on the output.

RT11 bridge is located in rural area and has fairly low traffic. In this sense it presents a more difficult scenario then a high-traffic bridge in urban areas. Figure 4 illustrates vibration patterns caused by passing traffic and the output voltage of the energy harvester. It can be clearly seen the structure experiences significant vibrations only periodically, while most of the time harvester output is rather low.

Figure 4. Time history of bridge vibration (acceleration) and open circuit voltage of the generator

A wireless self-powered sensor has the following key tasks:

  1. Effectively convert AC voltage from the generator to DC voltage that can be used for powering of the sensors. Active intelligent conversion may raise the amount of available energy upto 500%.
  2. Store the accumulated energy until the level becomes sufficient to perform a useful task.
  3. Effectively use stored energy to perform a measurement and wireless transmission.

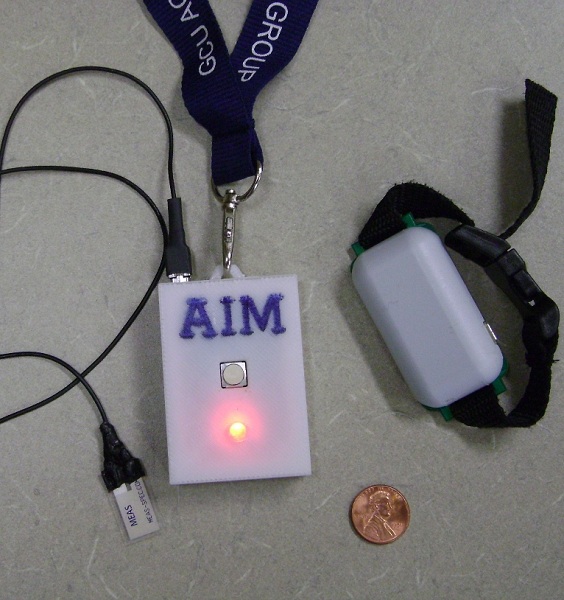
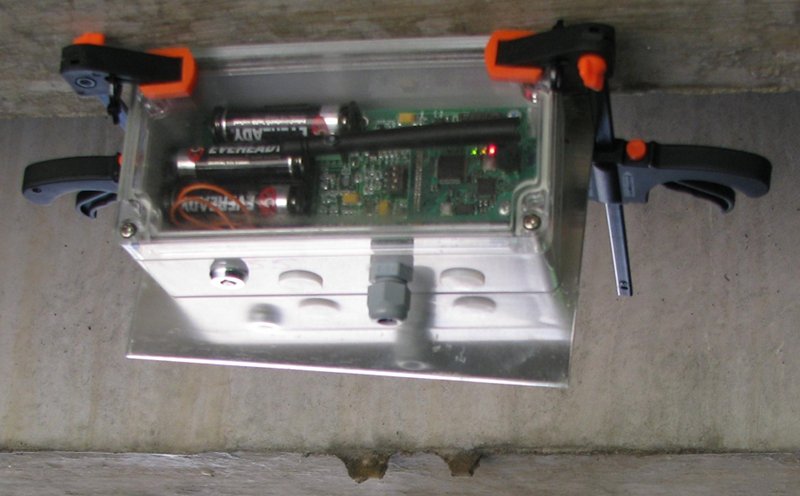
Figure 5 shows a wireless sensor platform that excels at all these tasks. This is a early prototype of a wireless platform that is now known as AmbioMote a product manufactured and sold by AmbioSystems.

Figure 5. Early prototype of AmbioMote.

Ambiomote is designed to work with high-impedance high-voltage energy harvester such as electromagnetic and piezoelectric generators. The devices handles intelligent energy (AC->DC) conversion, significantly boosting the efficiency of energy harvesting Figure 6 shows the charge on a storage capacitor after a single pulse excitation of electromagnetic generator. Compared to a regular rectifier-capacitor pair, AmbioMote is capable of capturing 400% greater energy! (E=0.5CV2)

AmbioMote provides low-leakage multi-stage storage, a high-speed (2Mbps) radio, a variety of digital and analog sensor interfaces. A single 6-byte radio transmission uses only 4.5 uJ of energy, a read of a temperature sensor 8 uJ, and so on.

Figure 6. AmbioMote (left) and rectifier-capacitor harvesting a single 10mm displacement pulse from the linear generator. on a1000uF storage capacitor.

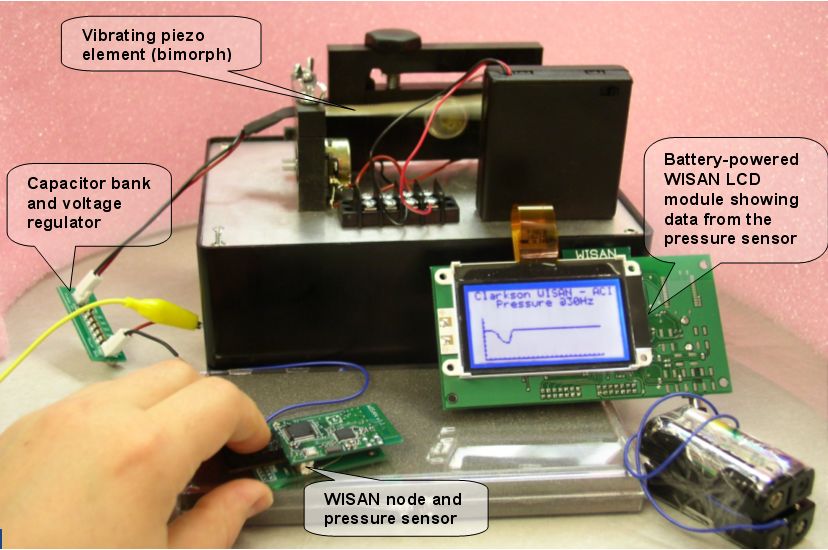
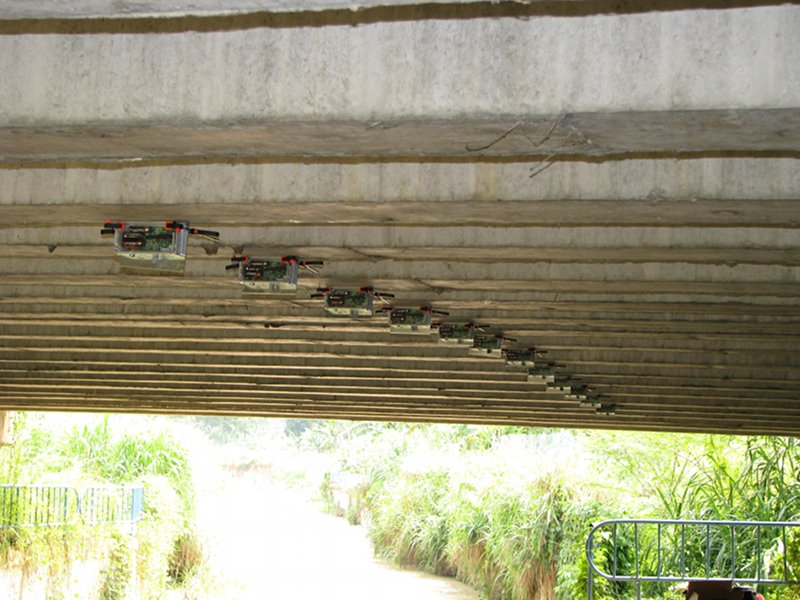
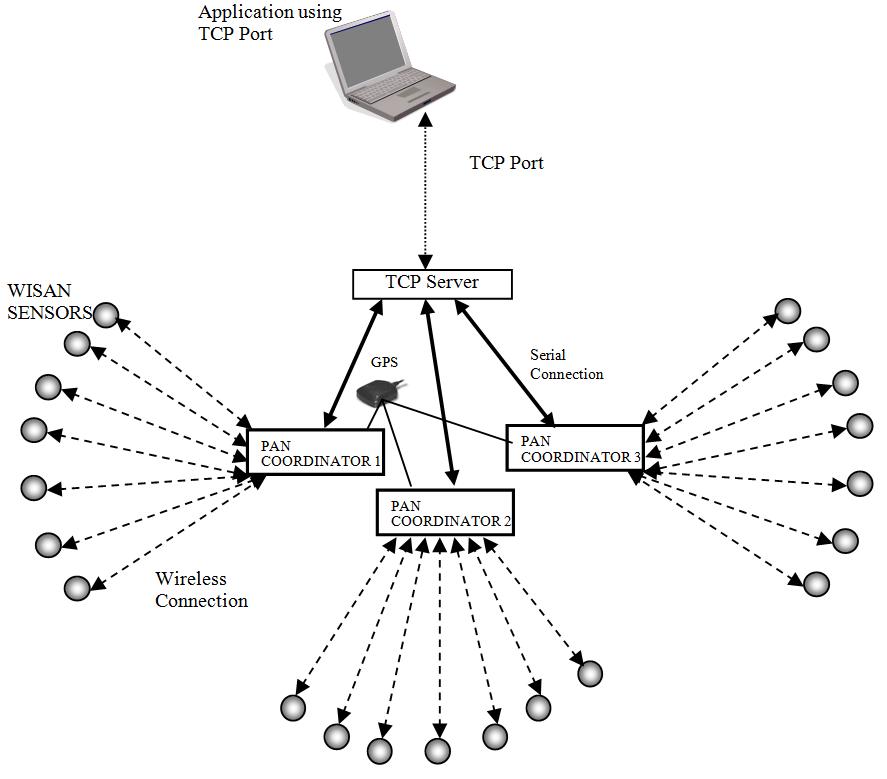
A bridge experiment was conducted in June 2007 using the following setup (Figure 7). The energy harvester was clamped to the bottom flange of the girder. The output of the energy harvester powered the AmbioMote prototype. When stored energy became sufficient for an atomic operation, AmbioMote woke up from sleep mode, measured temperature and transmitted the measurement via the wireless interface. A receiver module was connected to a portable computer on a USB port. On each reception the receiver would display reception time, sensor ID and temperature value on the computer screen.

Figure 7. Bridge experiment setup.

Bridge energy harvesting video

The following video illustrates the bridge self-powered sensor in action. The video consists of two short segments. The first segment shows wireless transmissions generated by the sensor from excitation generated by a medium-sized truck. The second illustrates transmissions generated by a heavy truck.


24-hr monitoring

The self powered sensor is capable of monitoring bridge condition for 24-rs. The following graph shows the number fo measurements per hour in one day of September 2007. As the graph shows, even deep in the night, the energy harvesting devices generate enough power to perform measurements.

Conclusions

We have crated a proof-of the concept device that uses vibration of a highway bridge to power a wireless monitoring device. Such sensors can be used to monitor temperature, ice conditions, traffic flows and health status of highway bridges without need of maintenance for decades.

Acknowledgements

We gratefully acknowledge support provided by the Transportation Research Board of the National Academies.

May 2008. WISAN experiments on a pre-steressed concete bridge in Kuala Lumpur, Malaysia

Testing of a concrete prestressed bridge


WISAN was originally designed to monitor structures built using steel girder technology. However, the same principles could be applied to modal testing of pre-stressed concrete structures. The presented experiment had the goal of demonstrating that reconstruction of mode shapes of a pre-stressed concrete bridge is possible from the data captured by a time-synchronized sensor network. The bridge on Route 1 at Kuala Lumpur, Malaysia was chosen as the test location (Figure 1). The bridge is built using 22 pre-stressed concrete girders with integral abutment. Total length of the bridge is 18m, width is 22m. The highest point is 5m above ground level with easy access to girders available in area of about 3m from both supports (Figure 2). Due to accessibility limitations the network was setup by attaching 22 sensors to 11 middle girders at a distance of 2.8m from both supports as shown in Figure 3. Thus, the dimension of the part of the structure that was tested is 18m x 10m. The sensors were clamped to the side of an aluminum plate glued to the girder as shown in Figure 4. The PAN Coordinator station is placed under the bridge on the bottom left of the entire setup. The PAN Coordinator station consisted of 3 PAN Coordinators connected to a laptop via serial interface. GPS was used to provide pulse per second synchronization signal to the PAN Coordinators. The network configuration for the test is as shown in Figure 5.


The sensors formed three network clusters on three independent frequency channels. Acceleration data was sampled at the rate of 240.385 Hz and a data resolution of 14 bits. The cut-off frequency of the programmable filter was set to 100 Hz. Vehicular traffic over the bridge was the source of excitation. Acceleration data from the sensors were recorded for time intervals of 2 minutes, 5 minutes and 10 minutes. The data collected from all the sensors was processed using the output-output modal analysis software ARTeMIS.


Results

The acceleration response from each sensor location was processed using ARTeMIS and peaks were identified corresponding to the modal frequencies.  Corresponding bending mode shapes have been plotted in Figure 8 – Figure 9 by using the relative sensor amplitude at a particular mode frequency.


Acceleration data from a sensor located on the second girder (Figure 10) suggests a peak amplitude in the frequency spectrum of around 28 mg in the range of 8 – 12 Hz. Assuming this corresponds to the amplitude of the first bending mode observed at 10.74 Hz, the maximum displacement at the center (interpolating the data) would be around 50mg. With the sensor noise resolution of 0.5mg, the peak data resolution possible is around 7 bits out of 12 bits possible.


It is interesting to compare the results obtained from the concrete structure to those of a similarly-sized steel girder structure. In our previous work, we used WISAN to extract mode shapes from a RT31 steel bridge located in the Town of Lisbon, New York. This bridge has four steel girders (3m apart) and overall dimensions 19m x 10m. The bridge was equipped with 44 sensors, 11 sensors spaced equidistantly on each girder.

Comparison between the concrete and steel structures shows that both bridges have comparable modal frequencies predominantly in the range of 10Hz-30Hz. However, there is a significant difference in the maximal amplitude attained by the structural components. Testing of the concrete RT1 bridge in Kuala Lumpur was conducted under constant heavy traffic including heavy vehicles. The maximal amplitude of vibration at a distance of 2.8m from supports was 28 mg. Testing of the RT31 steel girder bridge in New York was under intermittent traffic with the most of one light vehicle on the bridge at a time. The maximal amplitude of vibration at a distance of 2.845m from supports was 24 mg. As these results show, a steel bridge achieved comparable levels of excitation under a much lighter traffic. Practically this means that vibration sensors with lower noise floor are necessary for monitoring of pre-stressed concrete structures since vibration levels may be lower than those of steel girder bridges.


Fig1a - RT1 bridge Fig1b - RT1 bridge

Figure 1 (a): Photo of the bridge on Route 1 and (b) details of the bridge from the test site


Fig2 - under the RT1 bridge

Figure 2: View from under the bridge


Fig3 - layout of wireless sensor network

Figure 3: Layout of the bridge test setup for the four girder grid setup


Fig4a - sensor attached to the bridge Fig4b - WISAN sensors on a bridge

Figure 4: View of (a) single sensor and (b) 11 sensors attached to the girders


Fig5 - network configuration


Figure 5: network configuration


Fig6 - mode shapes

Figure 6: Mode shapes along the length of the bridge at frequencies (a) 10.74 Hz and (b) 32.1 Hz


Fig7 - higher mode shapes

Figure 7: Mode shapes along the width of the bridge at frequencies (a)15.43Hz (b) 18.49 Hz (c) 23.18 and (b) 29.05 Hz

We use cookies

We use cookies on our website. Some of them are essential for the operation of the site, while others help us to improve this site and the user experience (tracking cookies). You can decide for yourself whether you want to allow cookies or not. Please note that if you reject them, you may not be able to use all the functionalities of the site.